DOI:10.1016/j.jplph.2022.153807
发表期刊:Journal of Plant Physiology
链接:https://doi.org/10.1016/j.jplph.2022.153807
作者:Shao-Bo Cheng#, Xun-Zhe Yang#, Li Zou, Dan-Dan Wu, Jia-Le Lu, Yi-Ran Cheng, Yi Wang, Jian Zeng, Hou-Yang Kang, Li-Na Sha, Xing Fan, Xiao Ma, Xin-Quan Zhang, Yong-Hong Zhou, Hai-Qin Zhang *
Abstract:Annual ryegrass is a widely cultivated forage grass with rapid growth and high productivity. However, drought is one of the abiotic stresses affecting ryegrass growth and quality. In this study, we compared the physiological and transcriptome responses of Chuansi No.1 (drought-tolerant, DT) and Double Barrel (drought-sensitive, DS) under drought stress simulated by PEG-6000 for 7 days. The results showed that Chuansi No. 1 had stronger physiological and biochemical parameters such as root properties, water content, osmotic adjustment ability and antioxidant ability. In addition, RNA-seq was used to elucidate the molecular mechanism of root drought resistance. We identified 8588 differentially expressed genes related to drought tolerance in root, which were mainly enriched in oxidation-reduction process, carbohydrate metabolic process, apoplast, arginine and proline metabolism, and phenylpropanoid biosynthesis pathways. The expression levels of DEGs were consistent with physiological changes of ryegrass under drought stress. We found that genes related to sucrose and starch synthesis, root development, osmotic adjustment, ABA signal regulation and specifically up-regulated transcription factors such as WRKY41, WRKY51, ERF7, ERF109, ERF110, NAC43, NAC68, bHLH162 and bHLH148 in Chuansi No. 1 may be the reason for its higher drought tolerance. This study revealed the underlying physiological and molecular mechanisms of root response to drought stress in ryegrass and provided some new candidate genes for breeding rye drought tolerant varieties.

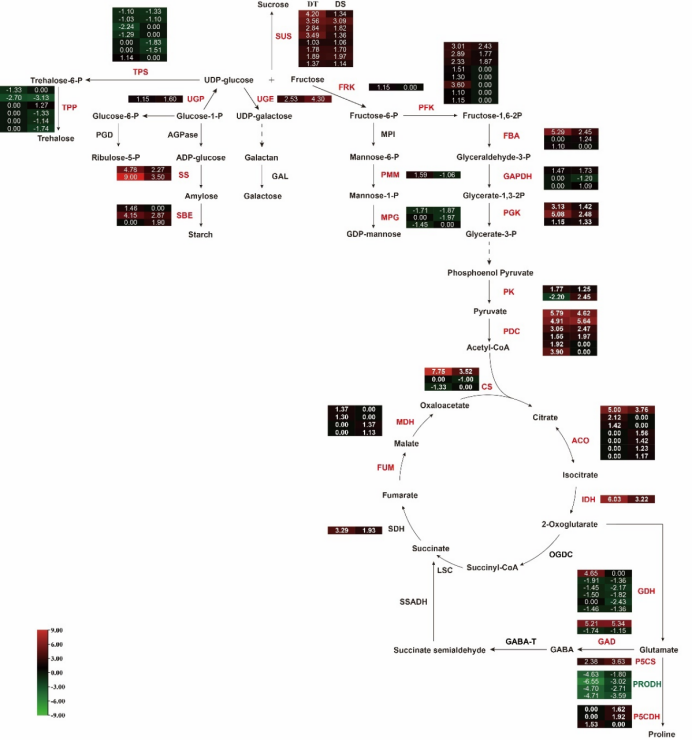
The carbon and glutamate metabolism pathways in roots of Chuansi No.1 (DT) and Double Barrel (DS). Genes were displayed by different colors. Relative levels of expression were showed by a color gradient from low (green) to high (red). The squares are ordered from left to right: DT and DS. The numbers in the scale bar stand for the log2 (fold changes) in gene expression.